BLOG
How to Read a Profit and Loss Statement
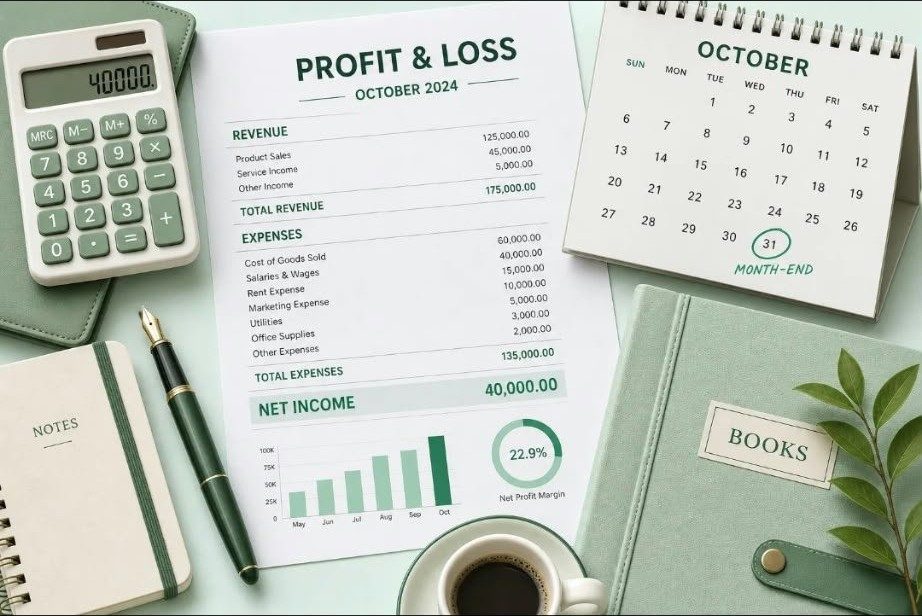
Most owners open the P&L, glance at the bottom line, and close it — the rest looks like a wall of accounting labels. That's a missed opportunity. Your P&L answers three questions that matter more than almost anything else: did we actually make money, where exactly did it go, and what is changing.
This guide walks through a P&L line by line with a realistic example, covers the few ratios worth tracking, and flags the warning signs. No accounting degree required.
What a Profit and Loss Statement Is (and Isn't)
A profit and loss statement — or income statement — summarizes your business's revenue, costs, and expenses over a specific period: a month, quarter, or year. The bottom line is net income (or net loss). That focus is what makes it useful.
Just as important is what a P&L is not:
- It is not your bank balance. You can hold cash and still have lost money this month — or be profitable while the account looks thin because customers haven't paid yet.
- It is not your balance sheet. The balance sheet shows what you own and owe at a single point in time (equipment, loans, credit card balances). The P&L shows performance over time.
- It is not a cash flow statement. A P&L can show a profit in a month when very little cash actually arrived — which is why owners get confused.
That comes down to cash basis vs. accrual basis accounting:
- Cash basis: income counts when the money hits your account; expenses count when you actually pay. Simple and intuitive.
- Accrual basis: income counts when you earn it (invoice sent); expenses count when you incur them (bill arrived) — even before cash moves. This matches income to the same period's costs: a truer performance picture.
Example: you invoice $5,000 on September 28 and get paid October 10. Cash basis shows it in October; accrual shows it in September, when earned. Neither is wrong — but know which basis you're reading. QuickBooks shows either; if you're unsure which fits, ask your CPA.
Walking Through a P&L, Line by Line
Here's a realistic monthly P&L for a small service business — we'll use these numbers throughout:
| Line item | September 2026 |
|---|---|
| Revenue | $24,500 |
| Cost of goods sold (COGS) | $7,350 |
| Gross profit | $17,150 |
| Operating expenses | |
| Payroll & wages | $6,200 |
| Rent | $1,500 |
| Insurance | $450 |
| Software & subscriptions | $280 |
| Vehicle & fuel | $620 |
| Office supplies | $180 |
| Marketing & advertising | $400 |
| Professional fees | $350 |
| Utilities | $290 |
| Merchant & bank fees | $180 |
| Total operating expenses | $10,450 |
| Operating income | $6,700 |
| Other income / (expenses), net | ($105) |
| Net income | $6,595 |
Revenue is everything earned in the period. Here: $24,500. Ask: does this match expectations? A surprise usually means missing invoices or income in the wrong month.
Cost of goods sold (COGS) is the direct cost of what you sold: job materials, subcontract labor tied to specific work. Here: $7,350. Pure service businesses may have little or no COGS — then gross profit sits near revenue, and that's normal.
Gross profit is revenue minus COGS ($24,500 − $7,350 = $17,150). It tells you whether your pricing covers your direct costs before overhead enters the picture.
Operating expenses are the costs of running the business, untied to any single sale: payroll, rent, insurance, software, and the rest. Here: $10,450. This is where owners find surprises — forgotten subscriptions, creeping supply costs, quietly growing fees.
Operating income ($6,700) is gross profit minus operating expenses — profit from the core business before financing odds and ends.
Other income and expenses sit outside normal operations: interest earned or paid, gains or losses on equipment sales. Here: a net ($105), mostly loan interest.
Net income ($6,595) is the bottom line: what the business kept. Negative means a net loss for the period.
The Key Numbers to Watch: Margins and Ratios
Dollars tell you what happened; ratios tell you how well — and let you compare different-size months fairly. Three matter here:
- Gross margin = gross profit ÷ revenue = $17,150 ÷ $24,500 = 70%. Of every sales dollar, 70 cents remain after direct costs. If this shrinks, either your prices are too low for your costs or your direct costs are rising.
- Net margin = net income ÷ revenue = $6,595 ÷ $24,500 = 26.9%. This is the ultimate efficiency score: about 27 cents of every sales dollar became profit. It reflects everything — pricing, direct costs, and overhead discipline.
- Expense ratios = a category ÷ revenue. Operating expenses ran at 42.7% of revenue ($10,450 ÷ $24,500); payroll alone was 25.3%. Tracking a few big categories as percentages of revenue makes creep visible: if payroll drifts from 25% to 32% of revenue over six months, you will feel it in net margin before you notice it in dollars.
Margins vary enormously by industry — don't judge yourself against a number you saw online. Your most meaningful benchmark is your own history.
Compare Periods: What Trends Tell You
One month is a snapshot; several months are a story. Compare month-over-month and year-over-year (which strips out seasonality).
Take our example business. In August it had $22,000 of revenue, $6,820 of COGS, $9,900 of operating expenses, and $5,280 of net income (a 24.0% net margin). In September: revenue grew about 11% to $24,500, operating expenses grew only about 6% to $10,450, and net income jumped roughly 25% to $6,595, lifting net margin to 26.9%.
That pattern — revenue growing faster than expenses, margins expanding — is the healthy one: growth translating into profit, not just busier weeks. The reverse (revenue up 10%, expenses up 15%, margin sliding) is growth eating itself — catchable only by comparing periods.
When you compare, use percentages, not just dollars. A $500 increase in supplies means something very different at $20,000 of revenue than at $8,000.
Red Flags in Your P&L
Review your P&L monthly with an eye out for these warning signs:
- Margins shrinking while revenue grows. If revenue climbs but margin falls, costs are outpacing prices — review pricing, suppliers, or job-level profitability.
- Expenses outpacing revenue, month after month. One heavy month is normal; a steady upward drift as a share of revenue is how profits quietly disappear.
- Miscategorized items. Personal expenses in the business, or job materials booked as supplies instead of COGS — the latter inflates gross margin and corrupts pricing decisions. A bloated "Miscellaneous" balance means the books need cleanup.
- One great month hiding a bad trend. A single strong month can mask three weak ones. Always look at a rolling three-to-six-month view before concluding the business is healthy.
- Profit up but cash down. Customers may be paying slowly or receivables are swelling — investigate, don't panic, but never ignore it.
Two classic mistakes deserve special mention. First, judging the business on the bank balance instead of net income: the bank balance reflects timing (who paid, what cleared), not performance. Second, ignoring COGS: owners who only watch total expenses miss that their direct costs per job are rising, which is a pricing problem disguised as an expense problem.
How a Clean P&L Helps at Tax Time
Your P&L is where your tax preparer starts. Clean books — categorized transactions, reconciled accounts — make the handoff straightforward. Messy books mean a slower, costlier return with more risk of errors.
The same habits that keep your P&L trustworthy all year make tax season easier: reconcile monthly, separate business and personal spending, and file supporting documents where you can find them — your monthly bookkeeping checklist doing double duty.
One boundary to respect: your P&L shows what happened, but decisions about deductions, entity structure, or estimated payments belong to your tax professional. If a line on your P&L raises a tax question, write it down and bring it to your CPA — do not guess.
If reading your P&L each month feels like decoding a foreign language — or if you are not confident the numbers are right in the first place — that is exactly what monthly bookkeeping and financial reporting support is for. Book a free consultation and we will talk through where your books stand and what clean, useful financials would look like for your business.
Key Takeaways
- A P&L shows revenue, costs, and expenses for a period — it is not your bank balance, your balance sheet, or your cash flow.
- Know whether you are reading it on a cash or accrual basis; the same month can look very different under each.
- Follow the structure: revenue → COGS → gross profit → operating expenses → operating income → other items → net income.
- Track gross margin, net margin, and key expense ratios — and compare them against your own past months, not just last month's dollars.
- Watch for shrinking margins, expenses outpacing revenue, and miscategorized items; review a rolling three-to-six-month view.
- A clean, reconciled P&L is the foundation your tax preparer builds on — keep it accurate all year, and bring tax questions to your CPA.
Want books like these?
Monthly bookkeeping, catch-up and cleanup, and financial reports you can actually use — for U.S. small businesses.
Book a free consultation